Azure AppInsights 101: Boosting Your React App's Performance
Dec 26, 2023
Dec 26, 2023
Dec 26, 2023


Hey there, fellow coders!
Modern web applications are complex beasts, running on a myriad of services, consuming various resources, and engaging users in unique ways. The more intricate your app, the more challenging it is to keep track of performance, system health, and user experience. Without visibility, you're flying blind. This article serves as a guide to enlighten you. By using Azure Application Insights, you can effectively monitor and improve every aspect of your React application, from user activity to system health.
Today, we're diving into the art of setting up telemetry in a React app using Azure Application Insights. It's going to be a ride full of code, best practices, and some 'Aha!' moments. So, let's buckle up!
Why Telemetry, Anyway?
Imagine flying blind through a storm with your app having no data about its performance, user behavior, or system health. Scary, right? Telemetry is your radar in this scenario, giving you a real-time overview of what's happening inside your app. You get insights on server uptime, user activity, and overall system health. It's like having X-ray vision but for your code.
The Three Dimensions of Telemetry
Hey you! Yeah, you—the developer wondering how to level-up your app. Before we delve into the nitty-gritty of setting up telemetry in a React app, let's talk about why telemetry is so darn important. To do that, we need to break it down into three categories:
App Level 📱
Think of this as your app's personal diary. What are users clicking on? How long are they spending on each page? Do they encounter any errors? All these details can help you understand user behavior and preferences.
Service Level ⚙️
This one's all about the 'backend magic' that powers your app. Service-level telemetry focuses on how well your services are running. Are your APIs responding quickly? Is your database query efficient? Essentially, this helps you catch performance issues before they become real problems.
System Level 🖥️
Zoom out a little more, and you get to the system level. Here, it's all about resource utilization—CPU, memory, bandwidth, and more. By monitoring these, you can ensure that your app runs smoothly and scales seamlessly.
Azure AppInsights: Your Telemetry Superpower 🦸
Azure Application Insights (aka AppInsights) amplifies your telemetry game. It not only allows you to collect data but to understand, visualize, and share it too. Need to know more? Here's an in-depth article about its capabilities and features.
Getting Hands Dirty: Setting Up Telemetry
Enough talk, let's get to the action.
Stage 1: Initial Setup 🛠️
Head over to the Azure portal portal.azure.com.
Click on "+ Create a resource" and search for "Application Insights."
Hit "Create" and follow the wizard. Choose your subscription, resource group, and region.
Voila! You've set the stage for some telemetry magic. On to step two!
Stage 2: Instrumentation
Time to add some code to your React app. This is where the real fun begins!
Imports and Configurations
import { ReactPlugin } from '@microsoft/applicationinsights-react-js';
import { ClickAnalyticsPlugin } from '@microsoft/applicationinsights-clickanalytics-js';
import { createBrowserHistory } from "history";
const browserHistory = createBrowserHistory({ basename: '' });
var reactPlugin = new ReactPlugin();
// *** Add the Click Analytics plug-in. ***
var clickPluginInstance = new ClickAnalyticsPlugin();
var clickPluginConfig = {
     autoCapture: true,
     dataTags: { useDefaultContentNameOrId: true }
};
Here we import all the necessary modules from Azure's SDK and create a browser history object. You might wonder why we need click analytics. Well, it's going to help us track user clicks, baby!
Configuring App Insights
var appInsights = new ApplicationInsights({
    config: {
        connectionString: 'Put in your instrumentation key here',
        // *** If you're adding the Click Analytics plug-in, delete the next line. ***
        // extensions: [reactPlugin],
     // *** Add the Click Analytics plug-in. ***
        extensions: [reactPlugin, clickPluginInstance],
        extensionConfig: {
          [reactPlugin.identifier]: { history: browserHistory },
       // *** Add the Click Analytics plug-in. ***
          [clickPluginInstance.identifier]: clickPluginConfig
        }
    }
});
appInsights.loadAppInsights();
Notice the connectionString? That's where your Azure's instrumentation key goes.
The Magic of Autoinstrumentation
This code was added directly to my index.js file and I also chose to enable clickinsights. Click Insights basically helps logs user clicks with specific data and parameters we can customise.
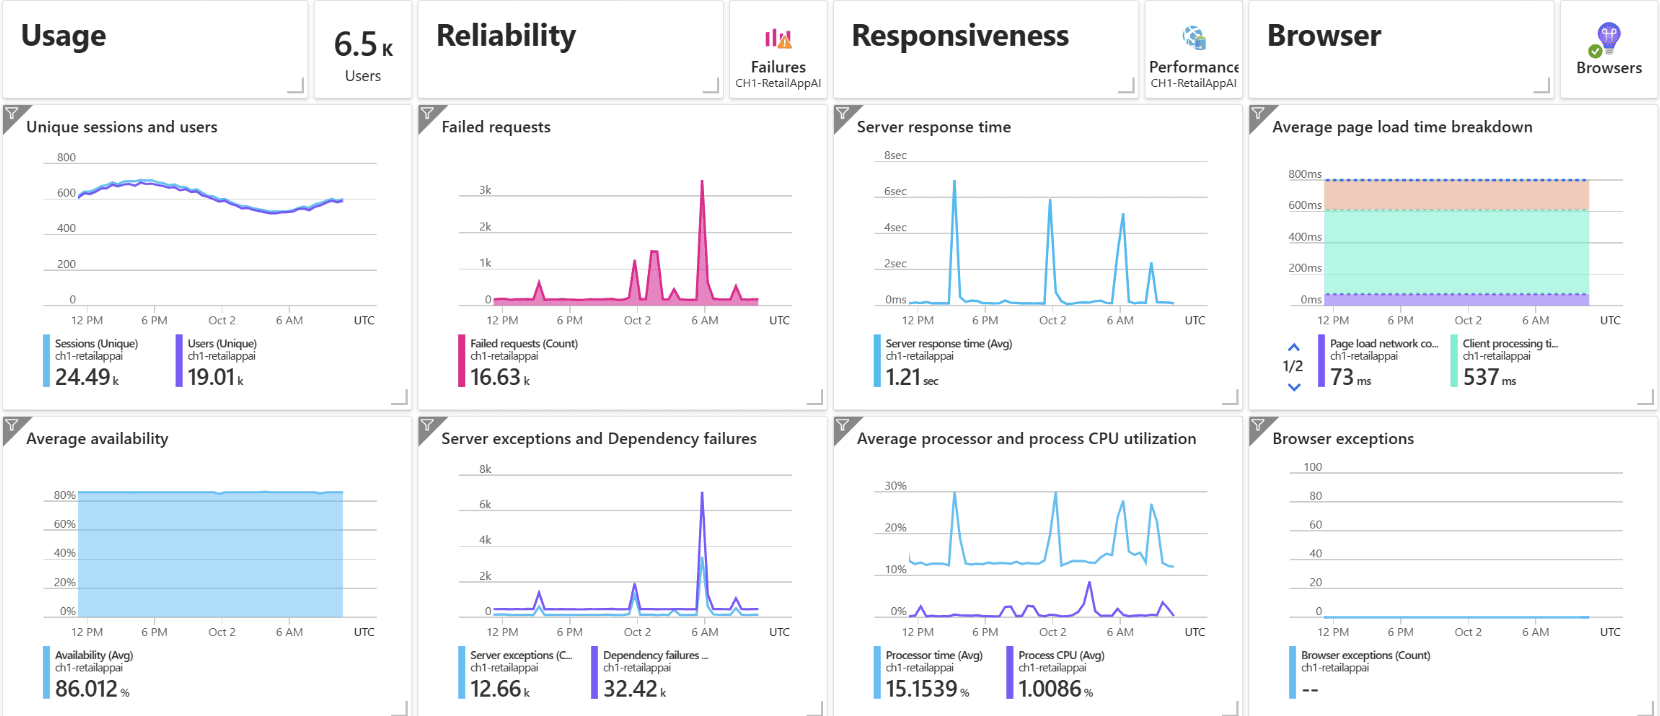
Just by adding this chunk of code, Azure starts collecting valuable data like page views, API calls, and, thanks to click insights, data about where the user clicks. Autoinstrumentation is like that friend who knows what you need before you say it. It automatically collects data with zero changes to your existing code. Autoinstrumentation enables Application Insights to make telemetry like metrics, requests, and dependencies available in your Application Insights resource. It provides easy access to experiences such as the application dashboard and application map.
Pro Tip 💡
Had issues with event names not showing up? Add dataTags: { useDefaultContentNameOrId: true } to your clickPluginConfig. It took me a while to figure that one out!
Custom Event Tracking
const handleFinalChange = (event, value) => {
    appInsights.trackEvent({ name: 'Slider', properties: { "value": value }});
};
If basic tracking doesn't tickle your fancy, go for custom events. In our app, we log the final value of a slider using a custom event. Neat, huh?
Summing It Up
There you go! We've journeyed from understanding the "Why" of telemetry to setting it up and running it on a React app with Azure. Don't believe how easy it is?
Check out the 🎥 demo👇 to see the data in action.
Now, it's your turn to supercharge your React apps with Azure AppInsights. Until next time, keep hacking and keep tracking! 🚀
Happy Coding! 🎉